In this revision, I incorporate Welford-via-Knuth into the running statistical calculation, providing a running mean/deviation calculation to show where the greater portion of insertion delay are.
Why?
The “mean” of a value is nearly useless for planning: it’s just an average. An understanding of how that value varies can help get a better idea of it just as any ability to match the behaviour to a predictable curve. A mean+/-1deviation can give a basic idea; a mean+/-3deviation can show where generally “all the non-unusual ones” land. Put another way, mean+/-3deviation can tell where all the value land once the aberrant outlying points are removed.
Currently, this means that the summary calculation now shows the mean delay plus the mean+1deviation “ceiling”: a mean +/- deviation provides two values of course, but we only worry about the worst case when a risk exists of taking too long to insert a summary row.
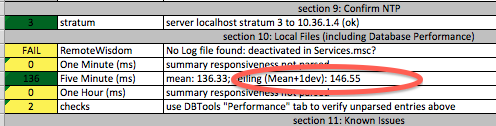
PHC-0.2-536 showing mean+1deviation
Currently, I’m not sure whether the mean+1deviation is the more critical value than the reported mean, nor whether we should shift to the mean+3deviation as a more appropriate metric.